
Introduction to Single Cell Sequencing Analysis (7): PHATE or Fate
In single-cell data analysis, the most critical step can be said to be the result of cell clustering; and cell clustering involves the design of many mathematical models, whether it is high-dimensional data conversion (dimensionality reduction), noise removal (denoising) and extraction Core information, etc., will affect the final cell clustering results, and therefore there are continuous methods to innovate in order to truly show the clustering distribution of cells. PHATE (Potential of Heat diffusion for Affinity-based Transition Embedding) [1] is a new way of dimensionality reduction. Before introducing this new method, the editor would like to review the past list with you The common dimensionality reduction methods of cell analysis are easier to understand in explaining its advantages.
PCA
Principal Component Analysis is a long-standing linear dimensionality reduction method. The method is to project data points in a new dimension, and find a representative combination of new data points that can explain the greatest degree of variation in this space (ie, principal components). With this mathematical calculation, data points with large differences can be separated and the relationship between clusters can be found; however, PCA is not suitable for complex data (for example, single-cell data, a gene represents a dimensional space), linear calculation The method is not enough to separate such complex and multi-dimensional data points in the 2D/3D images that are visible to the naked eye. Therefore, if the cell points are presented in PCA mode, the cells will be overlapped.
In order to solve this problem, t-SNE and UMAP methods were developed later to show better visual presentation of cell clustering.
t-SNE
t-SNE, t-distributed stochastic neighbour embedding [2, 3], is a non-linear dimensionality reduction method, this method is improved from the calculation of SNE (stochastic neighbour embedding), compared to SNE mainly changes (1) the cost function Calculation of cost function (considering symmetry) (2) Distribution rules (change to t-distribution assumption). The calculation concept is to obtain the distance between each data point and other data points, and then perform scaling after averaging the mutual distance between the two points, assuming that the data points are t-distributed, and finally arrange the data points with similar scores as much as possible.
(Description video:https://www.youtube.com/watch?v=NEaUSP4YerM ) When
UMAP
calculates a large amount of data, t-SNE may consume a lot of time, so later UMAP, Uniform Manifold Approximation and Projection [4] methods were proposed, in addition to saving calculation Time, the effect may even be better than t-SNE.
UMAP is a nonlinear dimensionality reduction method like t-SNE, which mainly introduces the concept of manifold, and has the following assumptions [5]:
- The data is uniformly distributed on Riemannian manifold;
- The Riemannian metric is locally constant (or can be approximated as such);
- The manifold is locally connected.
(Description video:https://www.youtube.com/watch?v=nq6iPZVUxZU )
t-SNE or UMAP seems to solve the PCA problem, but these two methods can achieve good clustering results while retaining only the local structure ( local structure), ignoring the global structure, the vernacular means:
Only find the “relationship” between the data points, but do not consider the “distance”
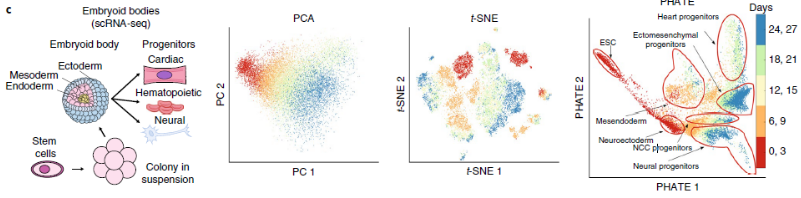
Take single cell analysis as an example. Regardless of the t-SNE or UMAP diagram, we can only know that a certain group of cells are similar and clustered together, but we cannot compare this group of cells with other cells or this group of cells from the diagram The distance between the various points .
PHATE
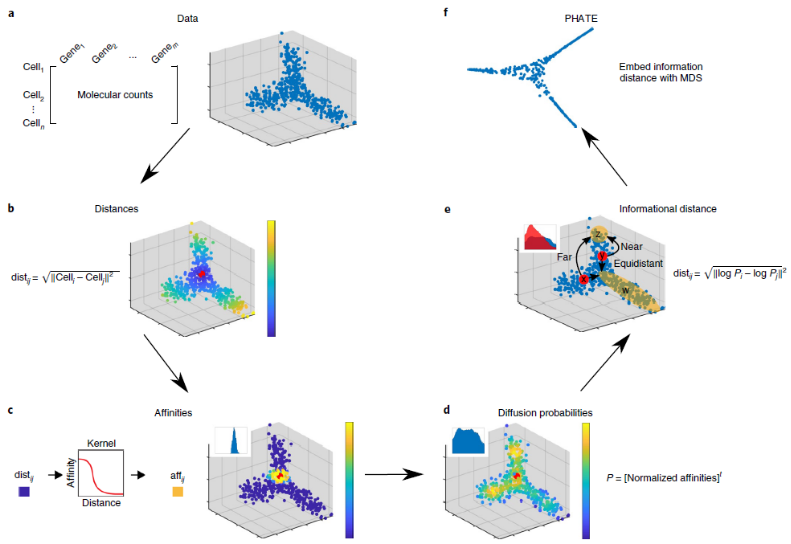
Potential of Heat diffusion for Affinity-based Transition Embedding is an article published in Nature at the end of 2019 [1]. This method claims to retain both the local structure and the global structure, and for implicit tree structure The data will have a better explanation.

The development of single cell technology is very rapid, and there will be other useful tools and methods in the future, and I will share with you.
Reference
1. Moon, KR, et al., Visualizing structure and transitions in high-dimensional biological data. Nature Biotechnology, 2019. 37(12): p. 1482-1492.
2. Van der Maaten, LJP and GE Hinton, Visualizing High-Dimensional Data Using t-SNE. Journal of Machine Learning Research, 2008. 9(nov): p. 2579-2605.
3. Kobak, D. and P. Berens, The art of using t-SNE for single- cell transcriptomics. Nature Communications, 2019. 10(1): p. 5416.
4. Leland McInnes, John Healy, and J. Melville, UMAP: Uniform manifold approximation and projection for dimension reduction. 2018. https://arxiv.org /abs/1802.03426.
5. Nasal Covid tests


You May Also Like
Behavioral Economic Laboratory Research in Tobacco Regulatory Science.

Robust Data Integration Method for Classification of Biomedical Data